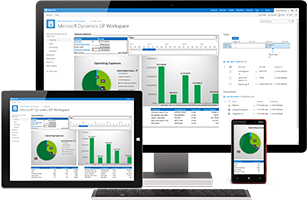
Big data has clearly become a big topic in the last year. Interestingly some of those same techniques and approaches cross over nicely to the CRM realm. Take visualization of data. With so many dataset possibilities both within Microsoft Dynamics, as well as importable data in your own organization, finding data is not the issue it used to be. To complete the picture, so to speak, Microsoft Dynamic’s flagship customer relationship management software also provides a rich set of built-in graphing and charting capabilities.
Within Microsoft Dynamics CRM, you can explore six different types of chart objects–column, bar, line, area, funnel, and pie – from the dashboard. Dynamics’ chart design tool lets non-technical sales and marketing support staff quickly create visualizations from either existing entities or customized views that were generated from SQL searches.
There is another powerful option available when adding a chart to a Dynamics’ dashboard. For this charting possibility, you’ll need to learn a little about iframes or inline frames. They are commonly used on web pages to allow for a “portal” into another site. The iframe scoops up the remote HTML, which is then rendered inside the current web page.
But that’s not anything you’ll have to worry about in terms of leveraging iframes in Microsoft CRM.
So what’s this have to do with charting? It only makes sense that not every piece of graphable data is going to be available to you. You may find there’s a relevant graph you’d like to include in your dashboard that’s being used in another area of your company or perhaps somewhere out on the Web.
Dynamics CRM solves this issue by providing a way to add iframes from the dashboard creation menu. Once the iframe dialog is up, you’ll be asked to provide a URL to the graph object you’re interested in. This typically involves copying the link from the embed or share code that is often provided by the graph.
Thankfully, we’re in a golden age of on-line charts with so many open-source tools to visualize data. So they’ll be no shortage of visualizations to pick from.
Along with big data, there’s now also a big opportunity, thanks to iframes, to add a greater variety of charts and graphs to your CRM software.