 In May Microsoft announced the start of the Microsoft Dynamics CRM Spring 2016 Wave phased roll-out. The 2016 update 1 for Microsoft Dynamics CRM introduced many new features to the solution, and we’ve been going over them since the announcement. Now, school is starting up again, football has returned to television, and it is already September, yet we are still going over all the new features in the Spring release of Microsoft Dynamics CRM! By the time we are done going over all the new features, it may be time for the next major release!
The latest release of Microsoft Dynamics CRM includes an improved out-of-the-box Sales Analytics Power BI Content Pack for sales managers. You’ll be able to analyze sales performance, sales pipeline, team activity, and lead pipeline data with detailed metrics and charts. See key metrics at a glance on a dashboard, such as Won Revenue, Win Rate, Average Deal Size, Open Revenue, New Leads, Conversion Rate, and Top Performers. Drill into reports to slice data by dimensions such as region, territory, industry, owner, etc. Data refresh performance has been improved with new Web APIs based on OData v4.
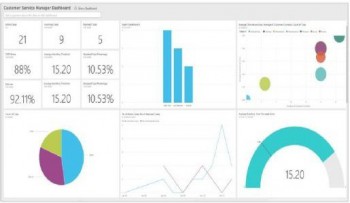
This release of Microsoft Dynamics CRM also includes an out-of-the-box Power BI Content Pack for customer service managers. They will be able to easily analyze service performance, incoming cases, and team activities with similarly detailed metrics and charts. On their dashboard they’ll be able to view the following: Average Handling Time, CSAT Score, of SLA Met, Resolved Cases, Active Cases, Escalated Cases, and Top Performers. And they can drill into reports to shape the data by time, owners, or subject area.